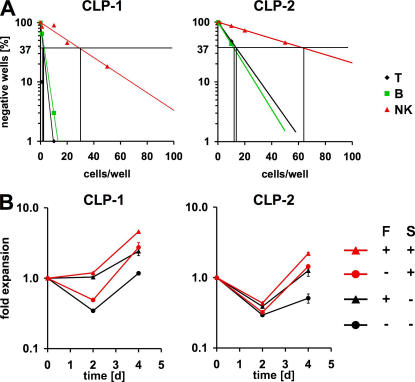
Figure 4.
Developmental potential in vitro and differential requirement for Flt3L of different precursor populations. (A) Limiting dilution analysis of T, B, and NK potential of BM-derived CLP-1 and CLP-2 cells. 1, 5, 10, 20, or 50 cells were directly sorted onto OP9-DL1 or OP9-GFP cells and analyzed by FACS after 18 d. (B) 103 sorted BM CLP-1 and CLP-2 cells were cultured on OP9-DL1 cells for 4 d in the presence or absence of Flt3L (5 ng/ml) or SCF (100 ng/ml) or both. Cell numbers were assessed during FACS analysis and are shown ± SEM.

