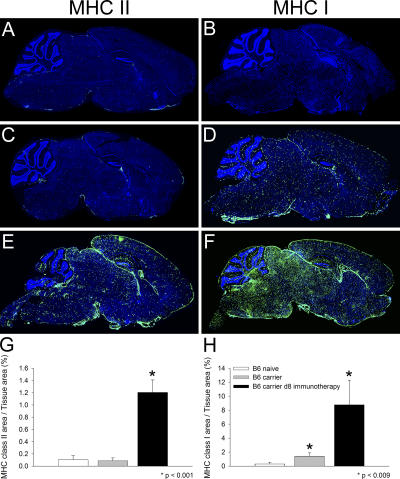
Figure 4.
Elevated MHC class I and II expression in the brains of immunocytotherapy recipients. Representative sagittal brain sections from naive (A and B; n = 4), LCMV carrier (C and D; n = 4), and LCMV carrier 8 d after immunocytotherapy (E and F; n = 4) were stained with an antibody directed against MHC class II (A, C, and E) or MHC class I (B, D, and F; green). Note the marked increase in the level of MHC class II (E; 14.4-fold increase) and class I (F; 27.9-fold increase) expression on sagittal brain reconstructions obtained from immunocytotherapy recipients. A modest increase in MHC I expression was also observed in LCMV carrier mice that did not receive immunotherapy (D; 4.4-fold). Cell nuclei are shown in blue. An image analysis program was used to quantify the amount of MHC class II (G) and I (H) staining on the sagittal brain sections shown in A–F. The data are represented as the mean + SD (error bars). Statistical differences from naive mice as determined by a one-way ANOVA (P < 0.05) are denoted by asterisks.

