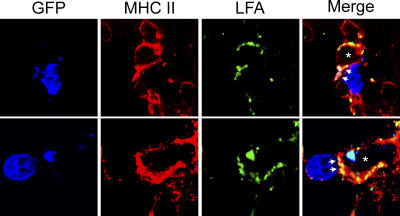
Figure 8.
Interactions between Thy1.1+DbGP33–41-specific T cells and MHC II+ APCs in the CNS of immunotherapy recipients. Three-color confocal microscopy was used to demonstrate immunological synapse formation between GFP+DbGP33–41-specific T cells (blue) and MHC II+ APCs (red) in the meninges, choroid plexus, and brain parenchyma of immunotherapy recipients. Immunological synapses were indicated by the polarization of the adhesion molecule LFA-1 (green) between the CTL and APC (25). Asterisks denote the engaged APC, and arrows denote the contact point between the two cells. LFA-1 is expressed on both CTLs and APCs, but note that all of the CTL-associated LFA-1 is focused toward a contact point at the CTL–APC interface. Two representative examples are shown for day 8 immunotherapy recipients (n = 3).

