Figure 5.
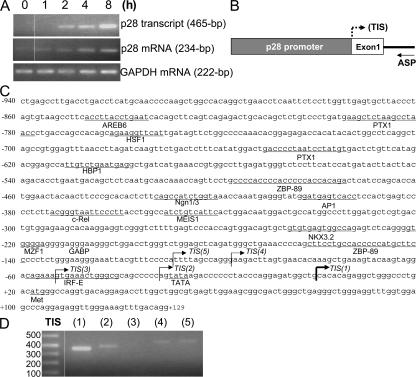
Mapping the IL-27 p28 promoter and the TISs. (A) Nascent p28 transcript and steady-state p28 mRNA expression. Total RNA was extracted from WT peritoneal macrophages treated with IFN-γ for different hours as indicated and reverse transcribed into cDNA using random primers. For p28 transcripts (top), a pair of primers flanking intron1 and exon2 were used for amplification by PCR. For steady-state p28 (middle) and GAPDH (bottom) mRNA amplification, the primers were derived from exons only. Data represents one of three experiments with similar results. (B) Schematic of the p28 promoter with the hypothetical TIS marked by a dashed arrow. The antisense primer (ASP) used in the RLM-RACE procedure corresponds to a segment in intron1. (C) Sequence of mouse p28 promoter that we cloned containing some putative transcription factor binding sites predicted by MatInspector and the five mapped TISs (arrows). The promoter coordinates (from −940 down to +129) are relative to the most dominant TIS(1) (thick arrow) located at +1. (D) Relative expression levels of transcripts initiated from the five different p28 TISs. Total RNA was extracted from WT peritoneal macrophages–treated IFN-γ (8 h) and 1 μg RNA was reverse transcribed into cDNA, which was then used to identify the p28 TIS by RLM-RACE. A common antisense primer and five distinct sense primers were used to amplify the differentially initiated p28 transcripts (mRNA) by PCR.

