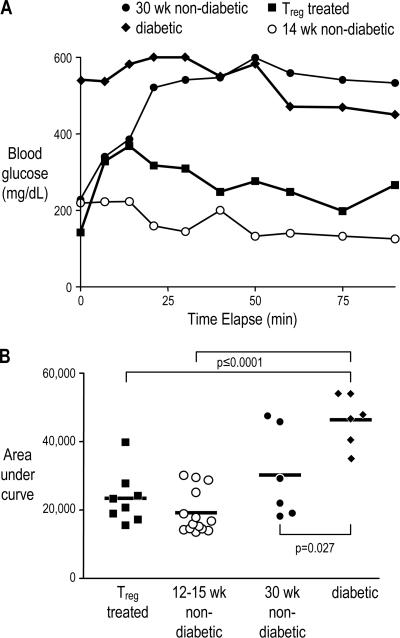
Figure 4.
T reg cell–treated mice have a normal response to glucose challenge. Glucose tolerance test in T reg cell–treated diabetic mice. Blood glucose levels were followed for 90 min after i.p. glucose injection into female NOD mice either successfully treated after diabetes onset with BDC T reg cells (closed squares), 12–15-wk-old (open circles) or 30 wk-old nondiabetic mice (closed circles), or diabetic mice (closed diamonds). One example of each group is shown in (A). For all mice tested, the area under the curve as shown in A was calculated, and the means of each group are indicated by the horizontal lines (B). P ≤ 0.0001 for both T reg cell–treated versus diabetic mice and 12–15-wk-old nondiabetic versus diabetic mice; P = 0.027 for 30-wk-old nondiabetic versus diabetic mice.

