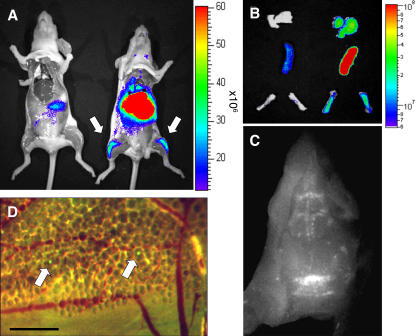
Figure 4.
Whole body imaging of Gr1high BM monocyte recipients. (A) Color-coded near-infrared fluorescent image overlaid on a photographic image of a CD1 nude mouse 16 h after tail vein injection of DiR-labeled BM monocytes (3 × 10⁶ cells; purity: 94%; right). Control (acquired on IVIS 100) is shown on the left. Note the presence of label in femura. (B) Color-coded near-infrared fluorescent image overlaid on a photographic image of isolated lung, spleen, and femura of CD1 nude recipients of DiR-labeled BM monocytes (right) and noninjected control (left; 3 × 10⁶ cells; purity: 94%). (C) Monochrome fluorescent microscopy image of a cranium of a CD1 nude mouse that received DiR-labeled BM monocytes (3 × 10⁶ cells; purity: 94%). Note the presence of labeled cells in bone cavities. (D) Dual-channel fluorescent microscopic image of a cranium of a C57BL/6 WT recipient mouse that had received an i.v. injection of CFSE-labeled BM monocytes (3 × 10⁶ cells; purity: 96%). Arrows indicate two graft-derived cells that extravasated into the BM parenchyma. Bar, 100 μm. The data are representative of two independent experiments.

