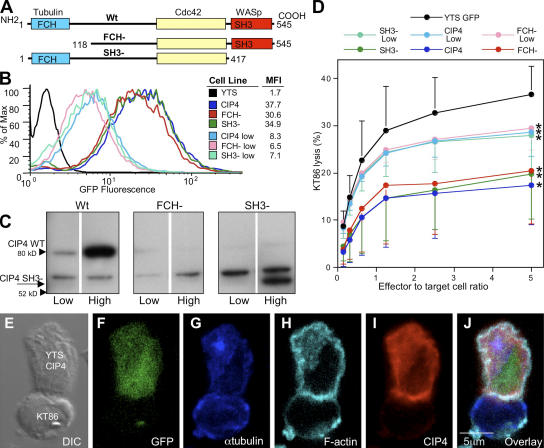
Figure 4.
Stable overexpression of CIP4 or CIP4 mutants in NK cells. (A) Schematic of constructs for CIP4 WT (top), CIP4 FCH− (middle), or SH3− (bottom) used to generate bicistronic retroviral expression vectors (blue, FCH domain; red, SH3 domain. (B) Transduced YTSeco cells were sorted via FACS into populations with comparable GFP expression (numbers show GFP MFI), and cultures had consistent GFP expression over time. (C) Western blot of CIP4 WT (left), CIP4 FCH− (middle), and CIP4 SH3− (right) low and high overexpressing cell lines using anti-CIP4 pAb. The middle band is nonspecific, and the antibody failed to recognize the FCH domain–deleted CIP4. (D) Cytotoxicity of CIP4-overexpressing YTS cells against KT86 target cells. Each point represents the mean of four experiments, and decreased activity was significant (P < 0.01) for all effector/target ratios in high, but only at 5:1 and 2.5:1 in low, overexpressing cells. (E and F) A representative conjugate between YTS CIP4 high overexpressing cells (top) and a KT86 target cell (bottom) was evaluated using DIC (E) and by confocal microscopy for GFP expression (F), α-tubulin (G), F-actin (H), CIP4 (I), and an overlay (J).

