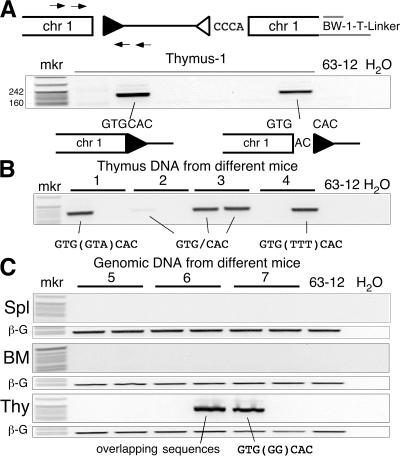
Figure 4.
A hotspot for Dβ1 RSS transposition (event b196). (A, top) Diagram of the captured Jβ1.1-RSS12 (open triangle) integration into chromosome 1 showing the PCR strategy used to assay for the corresponding Dβ1-RSS23 (filled triangle) integration. (middle) The negative image of an ethidium-stained agarose gel analysis of PCR products (189 bp) from 6 thymus DNA samples from the same animal. (bottom) Results of DNA sequence analysis with the junction sequence shown. Lane 63–12 is a RAG-2–deficient pro-B cell line. (B) PCR analysis of the Dβ1-RSS23 insertion into chromosome 1 using two aliquots of thymus DNA from each of four different mice (1–4). The DNA sequence at the chromosome 1–Dβ1 RSS junction is indicated below each amplified product. Nucleotides in parentheses are N regions. (C) PCR analysis of Dβ1-RSS23 insertion into chromosome 1 in two separate aliquots of thymus (Thy), spleen (Spl), and bone marrow (BM) DNA from three additional mice (5–7). β-Globin control PCR products (labeled β-G) show that similar amounts of DNA were amplified in each case. The chromosome 1—Dβ1-RSS23 products were sequenced as indicated. Overlapping sequences denote multiple sequences present in a single PCR band.

