Figure 3.
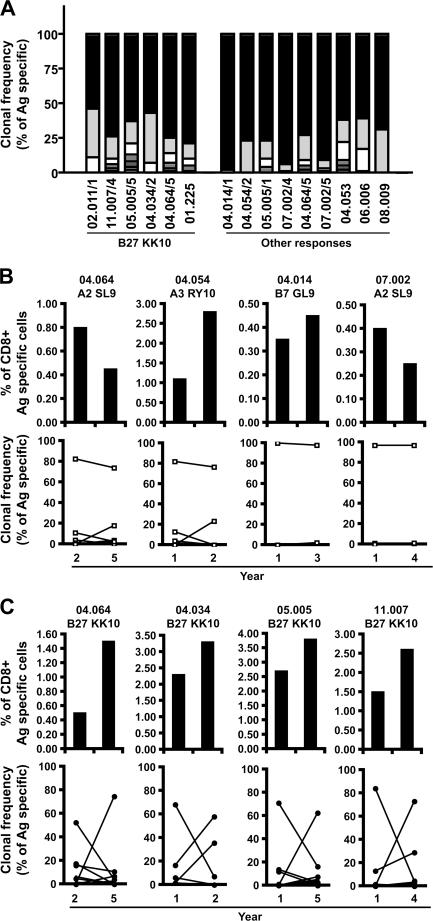
High turnover of B27-KK10–specific CD8+ T cell clonotypes. (A) Clonal composition of several CD8+ T cell populations specific for B27-KK10 or other epitopes. Clonotypic analysis was performed on FACS-sorted viable HIV-specific CD8+ T cells. The percent frequencies of single clonotypes within B27-KK10 or other HIV epitope–specific CD8+ T cell populations are shown; each bar represents one population from one donor and is subdivided into distinct clonotypes represented according to frequency. 6 B27-KK10 and 9 out of 13 other HIV epitope–specific CD8+ T cell populations are shown. Donor identification is provided under the bars, and a detailed clonotypic analysis (with sequences) is shown in Table I and Table S1. (B and C) Analysis of clonal dominance over two time points. The percent frequencies of HIV-specific CD8+ T cells, identified by cognate MHC class I–peptide multimeric complexes, within the total CD8+ population and clonal composition, represented as the frequency of individual clonotypes within sorted HIV-specific CD8+ T cell populations, are shown for four B27-KK10 (C) and four other HIV peptide–specific CD8+ T cell populations (B) separated by the indicated intervals. Donor identification and specific responses are indicated; a detailed clonotypic analysis with sequences is shown in Table S1.

