Figure 4.
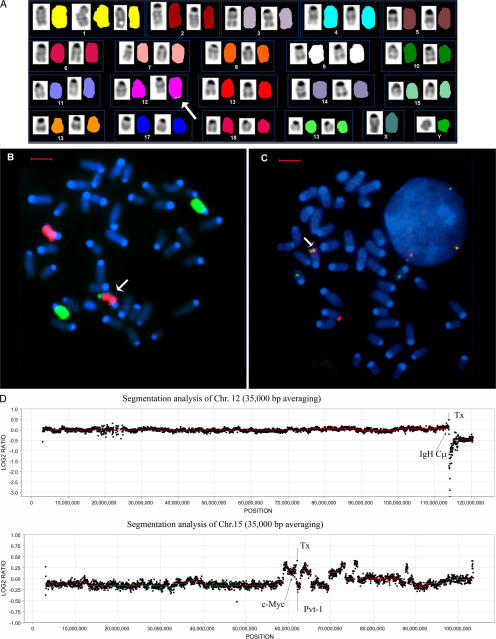
Molecular and cytogenetic analysis identifies the T(12;15) chromosomal translocation in the pBxAicda−/− cell line, 4885. (A) A representative karyotype of cell line 4885 analyzed by SKY shows a subtle translocation involving chromosome 12 and 15 as indicated by the arrow. (B) FISH using whole chromosome painting probes confirms a T(12;15) (arrow). Metaphase chromosomes are DAPI-stained. The normal chromosome 12 is depicted in red, and the normal chromosome 15 is shown in green. (C) FISH with gene-specific probes confirmed the involvement of c-Myc and IgH in the chromosomal rearrangement. Within the DAPI-stained metaphase, probes for c-Myc (green) and IgH (red) are colocalized on the abnormal chromosome (arrow). Additionally, c-Myc signals are present on the normal chromosome 15, whereas the signal for the IgH gene appears on the normal chromosome 12. (D) aCGH profile of the 4885 cell line. Locations of IgH Cμ (chromosome 12, top plot) and Pvt-1 (chromosome 15, bottom plot) are indicated by arrows pointing up. Translocation breakpoints (Tx) are depicted by arrows pointing down. Bars, 5 μm.

