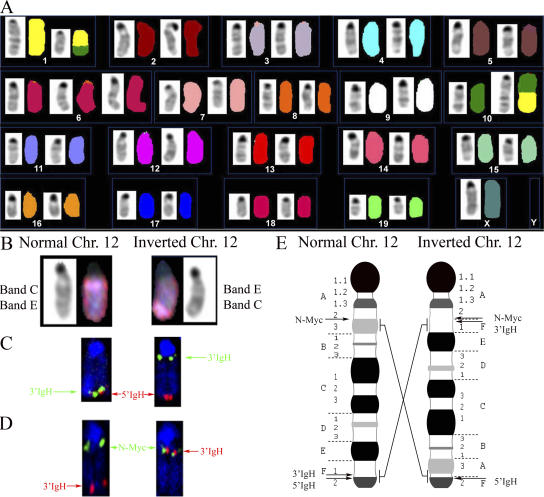
Figure 5.
Cytogenetic analysis of pBxAicda−/− cell line 4961. (A) SKY identifies a reciprocal T(1;10) translocation and trisomy 6. (B) Inverted DAPI staining and spectral image of normal (left) and inverted (right) chromosome 12 showing different band pattern on the inverted chromosome. (C) FISH with 3′IgH (green) and 5′IgH (red) gene-specific probes identifies one normal chromosome 12 (left) and breakage of the IgH locus on the other chromosome 12 (right) as the result of a paracentric inversion. (D) FISH shows colocalization of 3′IgH (green) and N-Myc (red) signals on inverted chromosome 12 (right) and their usual location at opposing ends on normal chromosome 12 (left). (E) Ideograms showing a normal chromosome 12 (left) and chromosome 12 with a paracentric inversion (right).

