Figure 5.
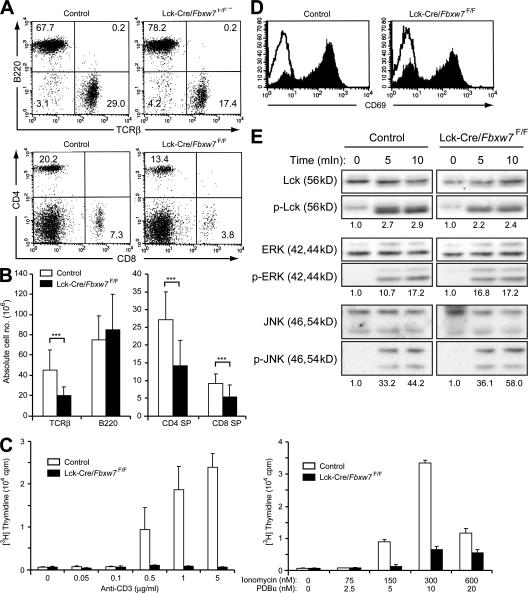
Proliferative defect of Fbxw7-deficient mature T cells. (A) Representative flow cytometric analysis of surface expression of TCRβ and B220 (top) or of CD4 and CD8 (bottom) on spleen cells from Fbxw7F/F (control) or Lck-Cre/Fbxw7F/F mice at 8 wk of age. The respective percentages are indicated. (B) Absolute cell numbers of splenocyte subsets determined as in A. Data are means ± SD of values from 8 Fbxw7F/F (control) and 14 Lck-Cre/Fbxw7F/F mice. ***, P < 0.005 using the Student's t test. (C) Splenic T cells from Lck-Cre/Fbxw7+/F (control) or Lck-Cre/Fbxw7F/F mice were stimulated for 48 h with the indicated concentrations of anti-CD3ε (left) or ionomycin and phorbol 12,13-dibutyrate (PDBu; right), after which the incorporation of [3H]thymidine was measured. Data are means ± SD of values from three independent experiments. (D) Splenic T cells from Fbxw7F/F (control) or Lck-Cre/Fbxw7F/F mice were left unstimulated (open trace) or stimulated with 5 μg/ml anti-CD3ε for 7 h (closed trace) and were then subjected to flow cytometric analysis for detection of the early activation antigen CD69. (E) Immunoblot analysis of phospho-Lck and Lck (loading control), phospho-ERK and ERK (loading control), and phospho-JNK and JNK (loading control) in splenic T cells from Fbxw7F/F (control) or Lck-Cre/Fbxw7F/F mice at 0, 5, and 10 min after stimulation with 5 μg/ml anti-CD3ε. The intensity of the bands corresponding to the phosphorylated proteins was normalized by that of total proteins. The value at time = 0 is defined as 1.

