Figure 3.
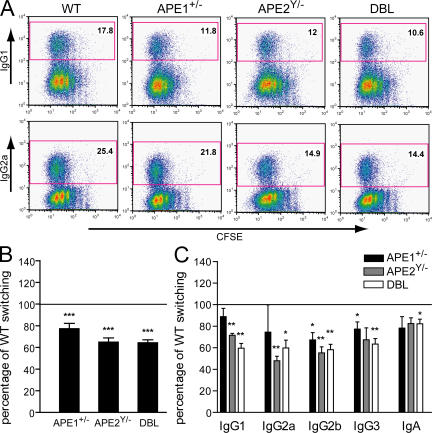
CSR is reduced in splenic B cells from mice with reduced levels of APEs. CFSE-stained splenic B cells were cultured for 3 d with LPS plus IL-4 (IgG1 switching); LPS plus IFN-γ (IgG2a); LPS plus dextran sulfate (IgG2b); LPS plus anti–δ-dextran (IgG3); LPS plus IL-4 plus IL-5 plus anti–δ-dextran plus TGF-β (IgA); and BlyS. Ig class switching was assessed by flow cytometry using Ig isotype–specific antibodies. At least four independent experiments were performed for each mouse and all isotypes, except for IgG2a (n = 3). For each experiment, splenic B cells from a WT littermate were used as a control. (A) Examples of FACS analyses for IgG1 and IgG2a switching in CFSE-stained cells. The percentage of switched cells is indicated in each plot. (B) The mean percentages (+SEM) of overall switching (all isotypes pooled) relative to WT are shown. WT switching was set at 100% (horizontal line). ***, P < 0.001, as determined by the one-sample t test. (C) The mean percentages (+SEM) of switching relative to WT for the different isotypes are shown. WT switching was set at 100% (horizontal line). *, P < 0.05; and **, P < 0.01, as determined by the one-sample t test.

