Figure 6.
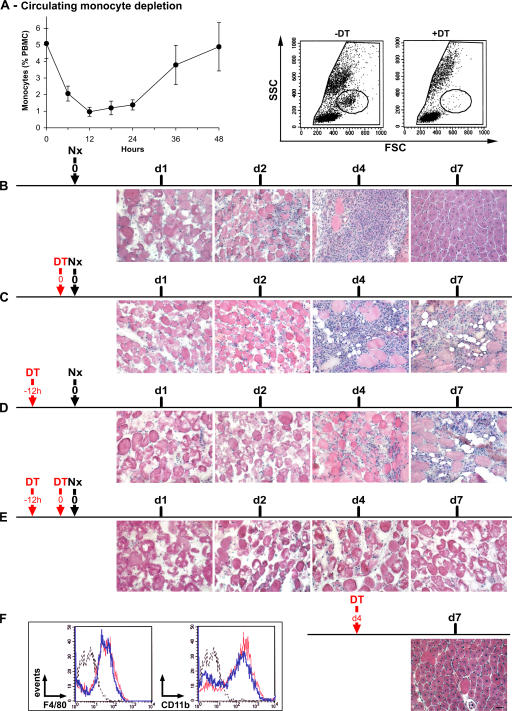
Effects of circulating MO depletion on skeletal muscle regeneration. (A, left) Kinetics of circulating MO depletion after one i.v. DT injection. Results represent the means ± SD of at least four experiments. (right) Examples of FACS analysis of blood before (−DT) and 18 h after i.v. DT injection (+DT). Circles show MO gate. (B–F) Notexin (Nx) was injected into the TA of CD11b-DTR mice at day 0, and DT was injected i.v. at various times, as indicated by the red arrows. Muscle histology was analyzed until day 7 after hematoxylin and eosin staining. Results are representative of at least two independent experiments. (F, inset) CD45+ cells were isolated from muscle and analyzed for F4/80 and CD11b expression 24 h after an i.v. DT (blue line) or PBS (red line) injection at day 4 after injury (black dotted line, isotypic control). Bar, 50 μm.

