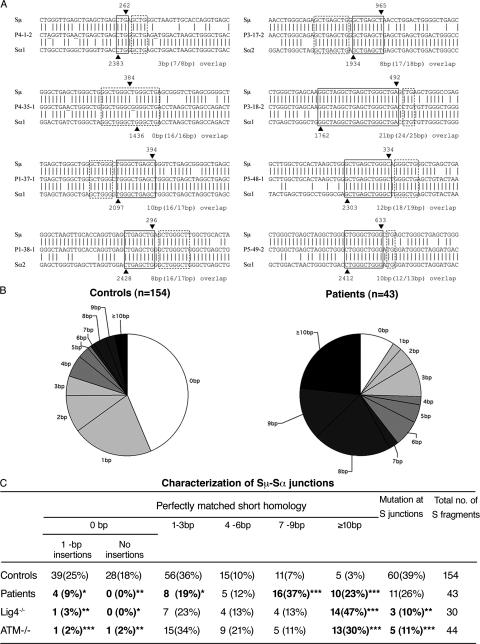
Figure 3.
Abnormal pattern of Sμ-Sα junctions in patients' B cells. (A) Sequences of Sμ-Sα junctions. Two sequences from each patient are shown. The Sμ and Sα1 or Sα2 sequences are aligned above and below the recombination switch junctional sequences. Microhomology was determined by identifying the longest region at the switch junction of perfect uninterrupted donor/acceptor identity (boxed with solid lines). Imperfect repeat was determined by identifying the longest overlap region at the switch junction by allowing one mismatch on either side of the breakpoint (the extra nucleotide identified beyond the perfect-matched sequence identity is boxed by dotted lines). The Sμ and Sα breakpoints for each switch fragment are indicated by ▾ and ▴, respectively, and their positions in the germ line sequences are indicated on top of or below the arrowheads. The number of base pairs involved in microhomology and imperfect repeat for each junction is shown at the bottom right of each switch junction. (B) Pie charts demonstrate the perfectly matched short homology usage at Sμ-Sα junctions in controls and patients. The proportion of switch junctions with a given size of perfectly matched short homology is indicated by the size of the slices. (C) Comparison of Sμ-Sα junctions in controls, patients described herein, and A-T and DNA ligase IV–deficient patients. *, P < 0.05; **, P < 0.01; ***, P < 0.001 (χ2 test).

