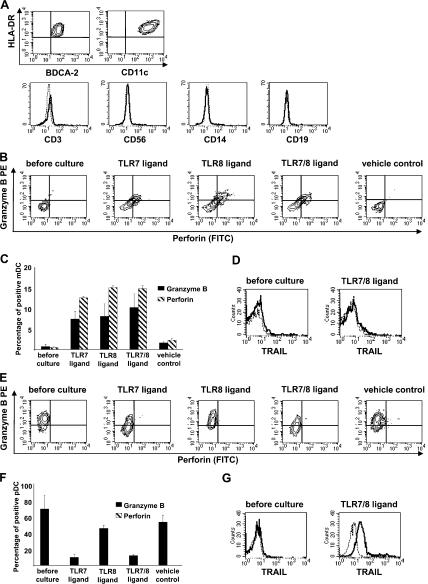
Figure 5.
Peripheral blood–derived DCs express lytic molecules after TLR7/8 stimulation. (A) Characterization of isolated peripheral blood–derived pDCs and mDCs as HLA-DR+BDCA-2+ and HLA-DR+CD11c+, respectively, and lineage-negative cell populations by flow cytometry. (B and C) Analysis of intracellular expression levels of perforin and granzyme B of isolated mDCs before and after culture with TLR7/8 agonists by flow cytometry. (B) Representative dot plots of mDCs show double-positive cells for perforin (FITC) and granzyme B (PE) after stimulation with TLR7, TLR8, and TLR7/8 agonists. (C) Quantitative analysis of granzyme B+ and perforin+ mDCs. Data are given as mean percentages of perforin- or granzyme B–positive mDCs ± SEM from three independent experiments. (D) Freshly isolated and TLR7/8-stimulated mDCs do not display membrane-bound TRAIL (A488). Representative histogram plots from three independent experiments show the anti-TRAIL reactivity (bold line) and the matching isotype control (dashed line). (E and F) Determination of intracellular expression levels of perforin and granzyme B on isolated pDCs before and after stimulation with TLR agonists. (E) Representative dot plots of pDCs show a decrease of granzyme B–positive cells after stimulation with TLR7 and TLR7/8 agonists. (F) Quantitative analysis of pDCs expressing perforin and granzyme B. Data are given as mean percentages of perforin- and granzyme B–positive cells ± SEM from three independent experiments. (G) TLR7/8-stimulated, but not freshly isolated, pDCs display membrane-bound TRAIL (A488). Representative histogram plots from three different experiments show the anti-TRAIL reactivity (bold line) and the matching isotype control (dashed line). Dead cells were excluded by gating out propidium iodide–positive cells in all experiments.

