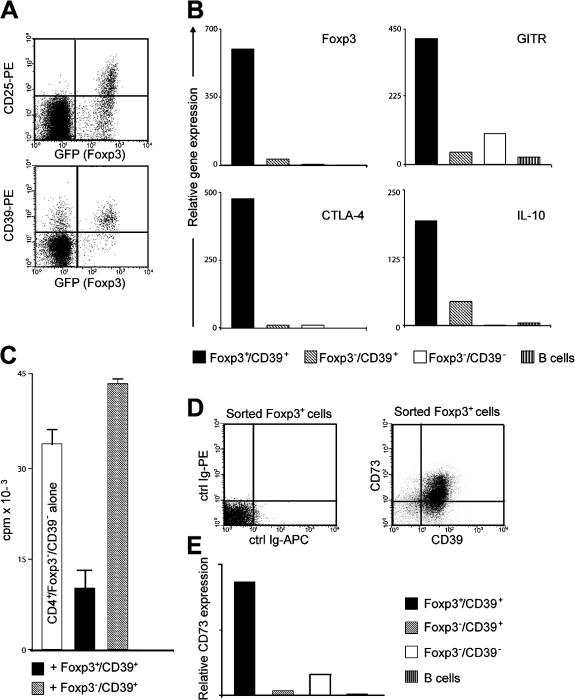
Figure 2.
Foxp3+ cells express CD39. (A) CD4+ T cells from Foxp3+ (GFP+) knock-in mice stained with CD25-PE or CD39-PE. (B) Real-time PCR analysis of Foxp3+/CD39+ (black bars), Foxp3−/CD39+ (shaded bars), and Foxp3−/CD39− (white bars) cells. (C) Foxp3+/CD39+ suppresses T effector (Foxp3−/CD39− CD4+) proliferation. [3H]Thymidine incorporation was measured after 72 h. Data are representative of two independent experiments, with error bars representing the SD of triplicate wells. (D) Foxp3+(GFP+) cells stained for CD39-APC and CD73-PE. (E) CD73 mRNA expression in Foxp3+/CD39+ (black bars), Foxp3−/CD39+ (shaded bars), Foxp3−/CD39− (white bars), and B lymphocytes (striped bars).

