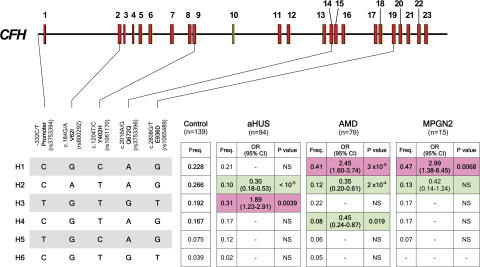
Figure 1.
Association analysis of CFH haplotypes with aHUS, AMD, and MPGN2 within a single population. Schematic illustration of the CFH exon structure demonstrating the location of the five SNPs included in these studies. These SNPs represent a minimal informative set for genetic variation within the CFH gene. CFH haplotypes with a frequency >3% are shown. The frequency of each CFH haplotype was compared with the controls and the aHUS, AMD, and MPGN2 cohorts, and the p-values and the OR were calculated. Risk haplotypes are shaded red, whereas protective haplotypes are shaded in green.p-values were derived using the two-sided Fisher's exact test. OR and 95% confidence interval (95% CI) are shown. See Table S1 for individual CFH SNP allele frequencies in patients with these conditions. The nucleotide and amino acid numbering refer to the translation start site (A in ATG is +1; Met is +1), as recommended by the Human Genome Variation Society.

