Figure 4.
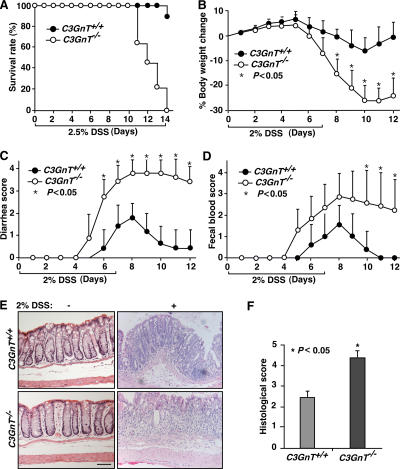
C3GnT−/− mice have more severe DSS-induced colitis. (A) Survival rate of a cohort of 10 age-matched C3GnT +/+ and C3GnT −/− males after a 14-d, 2.5% DSS treatment. (B–D) Percent body weight changes compared with baseline, diarrhea score, and fecal blood score in 6-wk-old C3GnT +/+ and C3GnT −/− males after a 7-d, 2% DSS treatment. Each point represents the mean ± the SEM. n = 10. (E) Hematoxylin and eosin–stained colonic tissues of C3GnT +/+ and C3GnT −/− mice with or without 2% DSS treatment. Bar, 100 μm. (F) Histopathological scores of C3GnT +/+ and C3GnT −/− mice 7 d after 2% DSS treatment based on degrees of inflammatory cell infiltration and epithelial injury. Error bars indicate mean ± the SEM. n = 12.

