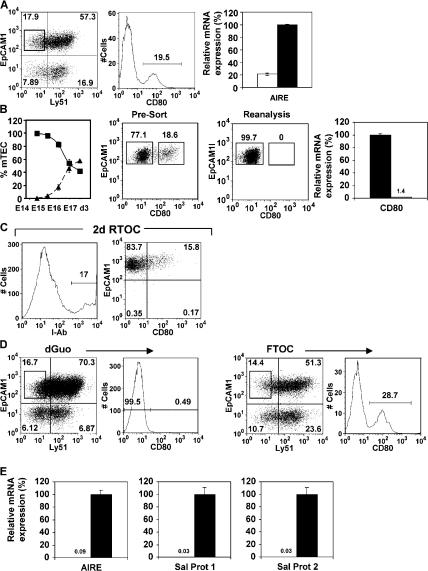
Figure 1.
Haemopoietic cells regulate mTEC development. EpCAM1+Ly51− mTECs in 7 d FTOCs (A) can be subdivided into CD80− and CD80+ subsets. qPCR anaysis shows mRNA for Aire is abundant in CD80+ mTECs (black bar) compared with CD80− mTECs (white bar). The left graph in B shows percentages of CD80− mTECs (▪) and CD80+ (▴) mTEC subsets within the total mTEC population, calculated after flow cytometric analysis of digested thymuses of the indicated ages. H-2b CD80− mTECs, shown by FACS (B) to lack surface CD80 expression and by PCR to lack CD80 mRNA (black bars, CD80+ mTEC; white bars, CD80− mTECs), were used to make RTOCs with H-2d thymus suspensions. RTOCs were analyzed for I-Ab (C, left), Ly51, EpCAM1, and CD80 expression after 2 d. Gating on I-Ab+ mTECs (C, right) shows CD80− mTECs have generated CD80+ mTECs. Analysis of mTECs in FTOCs or dGuo-treated FTOCs (D) shows absence of the CD80+ mTEC subset in dGuo FTOCs. qPCR analysis (E) shows Aire, SP1, and SP2 expression in mTECs from FTOCs (black bars) but not dGuo-treated FTOCs (white bars).

