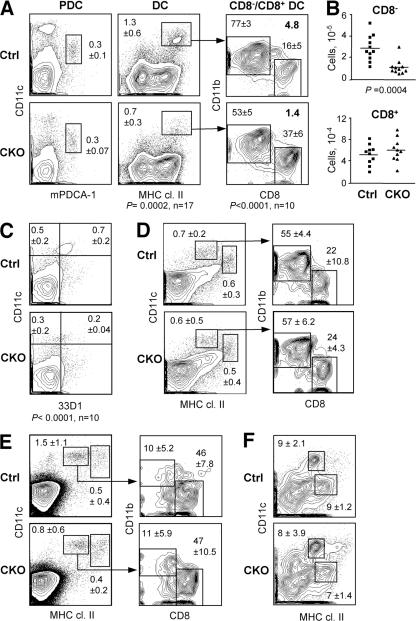
Figure 3.
The loss of splenic CD8− DCs in mice with DC-specific RBP-J deletion. Spleens from control (RBP-Jfl/fl) and CKO (RBP-Jfl/fl CD11c-Cre+) mice were analyzed for the indicated cell populations. (A) Staining profiles of PDCs and conventional DCs, with the percentages among total splenocytes indicated (mean ± SD of 3 and 17 animals per genotype, respectively). Within the DC population, the mean percentages of CD8− and CD8+ DC subsets and the CD8−/CD8+ DC ratio are shown. (B) Absolute numbers of CD8− and CD8+ DCs in individual control (squares) and CKO (triangles) mice. Horizontal lines represent the means. (C) Staining of splenic DCs with the CD8− DC–specific mAb 33D1, with the fractions of 33D1+ and 33D1− DCs among total splenocytes indicated. A threefold decrease in the absolute number of 33D1+ DCs was observed in CKO spleens (not depicted). (D and E) DC populations in the cutaneous lymph nodes (D) and the thymus (E). Shown are the staining profiles of lineage-depleted cells, with blood-derived (CD11chigh MHC class II+) and mature tissue-derived (CD11c+ MHC class IIhigh) DC populations highlighted. The percentages of these populations among the total cells of each organ are indicated (mean ± SD of four mice). Within the blood-derived DC population, the fractions of CD8− and CD8+ subsets are shown (mean ± SD of four mice). (F) Staining profiles of alveolar macrophages (CD11chigh MHC class II+) and conventional resident DCs (CD11clow MHC class IIhigh) in the lung. The percentage of each population among total lung cells is indicated (mean ± SD of four mice).

