Figure 2.
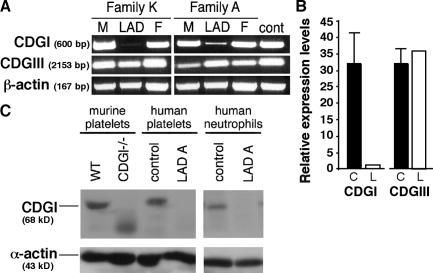
Loss of CalDAG-GEFI mRNA and protein in blood samples of two LAD patients. (A) CalDAG-GEFI amplified by RT-PCR from peripheral blood DNA derived from patients A and K and their parents using the primers listed in Fig. S1. Levels of CalDAG-GEFIII and actin transcripts are shown as controls. The data shown are representative of five independent experiments. (B) Relative CalDAG-GEFI and CalDAG-GEFIII mRNA expression levels were determined by Q-RT-PCR in LAD patient A (L) and an age-matched control (C). GusB was used for normalization for each gene, and normalization to HRPT1 gave similar results. The data are representative of three independent experiments. (C) Western blot analysis of platelet and neutrophil lysates derived from an age-matched control donor and LAD patient. CalDAG-GEFI (CDGI) levels were probed using the mAb 18B11. Left columns depict CalDAG-GEFI levels in wt and CalDAG-GEFI knockout murine platelets probed with the same mAb. Actin levels are shown as control.

