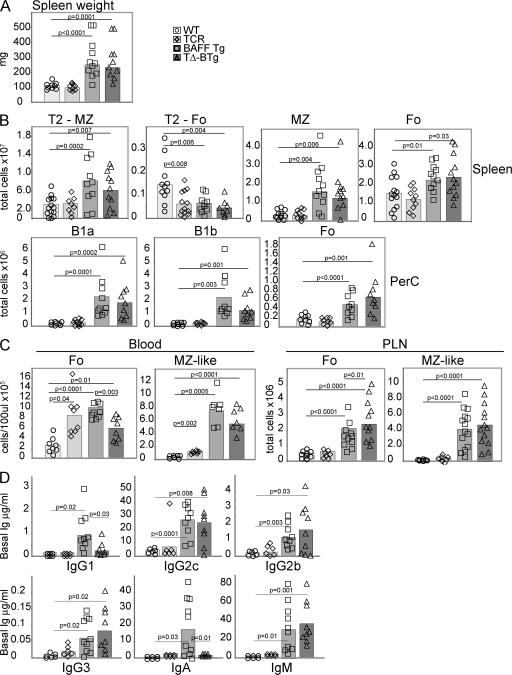
Figure 2.
Similar splenomegaly, B cell hyperplasia, and elevated Ig levels in TΔ-BTg and Baff Tg mice. 12-mo-old WT (circle), TCR−/− (diamond), BAFF Tg (square), and TΔ-BTg (triangle) mice were assessed for spleen size (A) and total numbers of T2-MZ, T2-Fo, MZ, and Fo B cell subsets in spleen and B1a, B1b, and Fo B cells in peritoneal lavage (PerC; B). (C) Fo and MZ B cells in peripheral blood (left) and PLN (right). Subsets were gated by FACS analysis as described in Materials and methods. (D) Basal Ig levels in TΔ-BTg mice and control mice. Symbols represent individual mice, and columns indicate the mean for each group. Significant P values are shown. n ≥ 7 per group.

