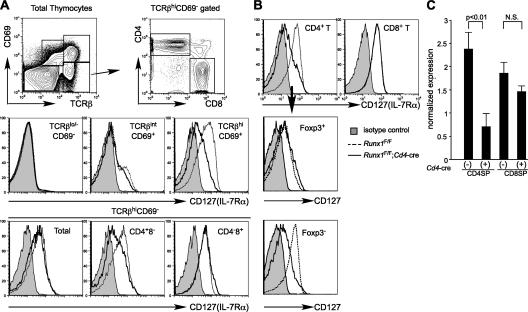
Figure 5.
IL-7Rα expression in developing thymocytes and T cells from Runx1F/F;Cd4-cre mice. (A) IL-7Rα (CD127) expression in thymocyte populations defined by rectangles (top) from Runx1 F/F (dotted histograms) and Runx1 F/F;Cd4-cre (open histograms) mice. (B) IL-7Rα expression in CD4+ and CD8+ lymph node T cells from Runx1 F/F (dotted histograms) and Runx1 F/F;Cd4-cre (open histograms) mice. CD4+ T cells were further subdivided into Foxp3+ and Foxp3− populations, and IL-7Rα expression in each subpopulation was compared between Runx1 F/F (dotted histograms) and Runx1 F/F;Cd4-cre (open histograms) mice. Shaded histograms in A and B are isotype staining controls. (C) Real-time PCR analysis of Il7r mRNA expression in mature thymocytes from Runx1 F/F;Cd4-cre and control Runx1 F/F mice. Il7r mRNA expression levels are normalized to Actb mRNA levels in individual samples. The relative Il7r mRNA expression is shown as the mean and standard deviation from three independent samples. Statistical differences were verified by the Student's t test. Flow cytometry data shown are representative of three to five mice.

