Figure 3.
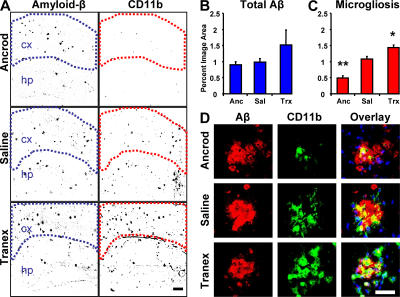
Fibrinogen depletion and inhibition of fibrinolysis in the 6-mo TgCRND8 mouse have opposite effects on neuroinflammation. (A) Representative immunofluorescent images of brains colabeled for Aβ (left) and CD11b, a marker for activated microglia (right). Regions of interest are outlined to demark the cortical region quantified in each image. Images show increased density of inflammatory foci in the cortex of plasmin-inhibited transgenic mice, whereas fibrinogen-depleted transgenics show decreased density relative to age-matched saline-treated TgCRND8 mice. Bar, 200 μm. (B) Analysis of total Aβ staining within marked regions of interest in the cortex; the differences were not significant (P > 0.05). (C) Analysis of CD11b staining shows increased inflammation density in the cortex of plasmin-inhibited transgenic mice, whereas fibrinogen-depleted transgenics show a decrease. Error bars present the mean ± SEM of four images for each of five ancrod-, four tranex-, and two saline-treated mice. *, P < 0.05; **, P < 0.001, relative to saline-treated mice. (D) High-magnification images of microglia (green) and Aβ plaques (red) in each treatment group. Bar, 50 μm.

