Figure 5.
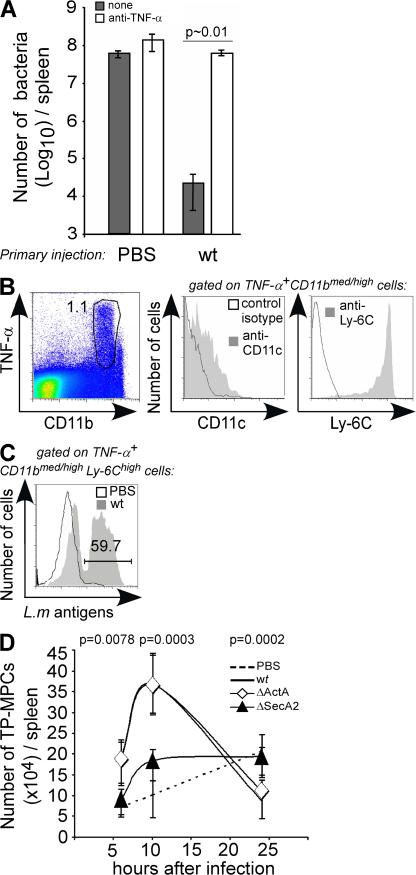
MPCs produce TNF-α during secondary protective response. (A) BALB/c mice (two per group) primary immunized with PBS or 0.1 × LD50 of WT bacteria were treated 30 d later with the soluble p75 TNF-α receptor (Enbrel) and secondary challenged with 3 × 10⁵ WT bacteria. Data show the number of bacteria (mean ± SE) in the spleen 2 d later in a representative (out of three) experiment. p-value was estimated accordingly to the rules of SE bars in the experiment shown (54). (B) Mice (two per group) were primary immunized and secondary challenged with WT bacteria (B and C) or PBS (C). 10 h later, spleen cells from individual mice were restimulated with HKLM (B) or not (C) and analyzed by FACS for surface staining of CD11b, Ly-6C, CD11c, and control isotype and for intracellular staining of L. monocytogenes–derived antigens and TNF-α. Data show representative FACS histograms after gating on the indicated cell population in a representative (out of three) experiment. (D) Mice primarily immunized with PBS, secA2 −, actA −, or WT bacteria were secondary challenged. At the indicated times, spleen cells from individual mice were restimulated with HKLM and analyzed by FACS for surface CD11b, Ly-6C, and intracellular TNF-α. The number (mean ± SD) of TNF-α–producing CD11bmed/highLy6Chigh mononuclear phagocytic cells (TP-MPCs) per spleen is indicated and result from the pool of three replicate experiments (n = 9). The p-values between the numbers of TP-MPCs in secA2 −- versus actA − -infected mice are indicated.

