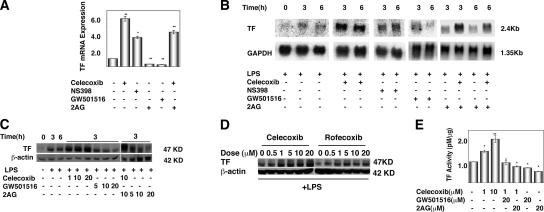
Figure 4.
COX-2 inhibitors enhance, whereas PPARδ activators suppress, TF gene expression in ECs. (A) qRT-PCR analysis of total RNA extracted from HUVECs upon treatment with 10 μM celecoxib, 10 μM NS398, 10 μM GW501516, 10 μM 2-AG, or DMSO (vehicle) for 3 h. Celecoxib and NS-398 were added 30 min before stimulation with 2-AG or GW501516 for 6 h. Human TF mRNA levels were normalized by the internal control gene GAPDH (*, P < 0.05; **, P <0.01, compared with vehicle). (B) Northern blot analysis of HUVECs treated with LPS for 3–6 h in the presence or absence of COX-2 inhibitors, GW501516, or 2-AG, as described in A. (C) Western blot analysis of TF expression in HUVECs. (D) TF expression in HUVEC extracts was assayed by Western blot analysis as described in Materials and methods. Cells were treated with indicated concentrations (micromolar) of various compounds (D and E) in the presence of 10 μg/ml LPS. (E) TF activity assay in LPS-stimulated HUVEC lysates treated as outlined above. TF concentration of test samples was directly calculated from the standard curve. *, P < 0.05; **, P < 0.01, compared with vehicle.

