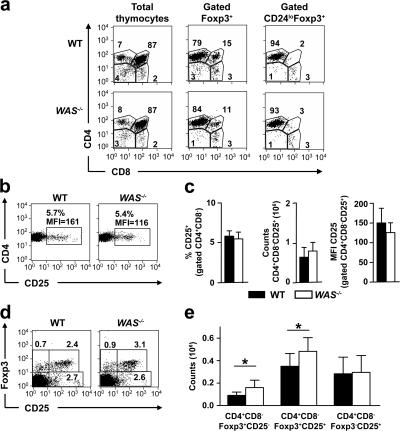
Figure 2.
Thymic generation of nTreg cells in WAS−/− mice. (a) Thymic development of nTreg cells in WT and WAS −/− mice. CD4/CD8 flow cytometric plots were gated on live thymocytes, total Foxp3+ cells, and mature CD24loFoxp3+ cells. Numbers indicate the percentage of cells in the respective region. Data are representative of 12 mice per group analyzed in three independent experiments. (b) Immunophenotype of CD4+ single positive thymocytes from representative WT and WAS −/− mice. Numbers indicate the percentages and MFI of CD25+ cells. (c) Percentage, absolute count, and MFI of CD25+ cells among CD4+ single positive thymocytes. Mean ± SD of 13 mice per group are shown. (d) Foxp3 and CD25 expression in CD4+ single positive thymocytes. Numbers indicate the percentage of cells in the respective region. (e) Absolute count of the indicated thymocyte populations. Mean ± SD of 13 mice per group is shown. *, P < 0.05, Student's t test.

