Figure 7.
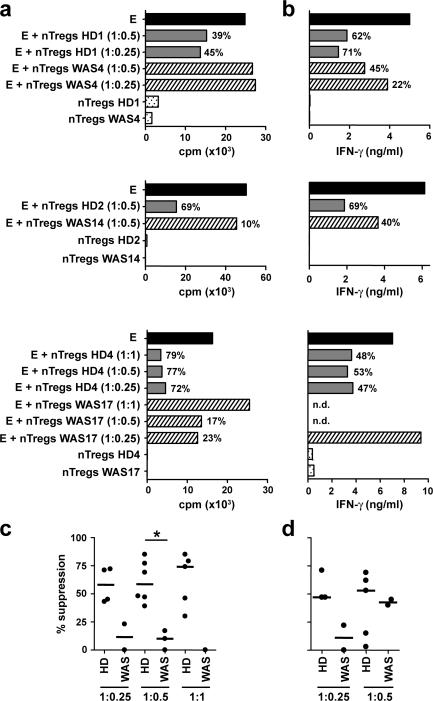
Allogeneic suppression by human nTreg cells. (a and b) Ability of nTreg cells freshly isolated from WAS patients and HDs to suppress allogeneic CD4+CD25− effector T cells from HDs. Effector T cells were cultured in the presence of nTreg cells at the indicated ratio and stimulated with CD3-depleted irradiated allogeneic APCs and anti-CD3 mAbs for 72 h (HD1 and WAS4), anti-CD3 mAbs plus anti-CD28 mAb–coated beads for 72 h (HD2 and WAS14), or anti-CD3 mAbs plus anti-CD28 mAb–coated beads for 120 h (HD4 and WAS17). Proliferation was measured by [3H]thymidine incorporation (a), and IFN-γ secretion was measured by cytometric bead array (b). Filled bars, activated effector T cells (abbreviated as E); gray bars, activated effector T cells in the presence of nTreg cells isolated from HDs; dashed bars, activated effector T cells in the presence of nTreg cells isolated from WAS patients; dotted bars, activated nTreg cells alone. Percentages of suppression are indicated. (c and d) Cumulative graph of allogeneic suppression of proliferation (c) and IFN-γ production (d) at the indicated effector T cell/nTreg cell ratio. Dots represent percentage of suppression of each HD or WAS patient, and bars depict the respective median value. *, P < 0.05, Mann-Whitney test.

