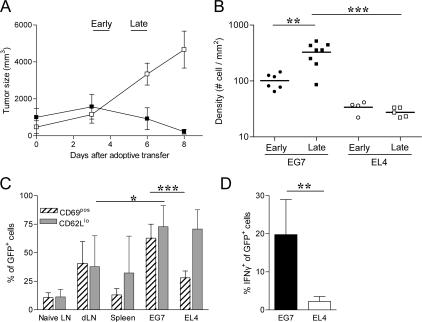
Figure 1.
Activation of specific T cells in antigen-expressing tumors. C57Bl6 mice were injected s.c. with five 105 EG7 and EL4 tumor cells in either flank. 8–10 d later, the mice were adoptively transferred with 107 purified naive CD8+ cells from OT1-GFP mice. (A) Evolution of EG7 (▪) and EL4 (□) tumor size after adoptive transfer. (mean ± SD, n = 5 independent experiments). Early phase (day 3–4) and late phase (day 5–6) were defined in Material and methods. (B) Density of OT1-GFP cells within EG7 and EL4 at early (day 3) and late (day 6) phase of tumor rejection were calculated from tumor section by counting the number of OT1-GFP cells per mm2. (C) Expression of CD69 (hatch marked) and CD62L (gray) activation markers in GFP+ cells as analyzed by flow cytometry (dLN, draining LN) (mean ± SD, n = 3–6). (D) IFN-γ production of GFP+ cells in EG7 and EL4 tumors after 3 h of treatment with Brefeldin A without antigen restimulation (mean ± SD, n = 5). *, P < 0.05; **, P < 0.01; ***, P < 0.001.

