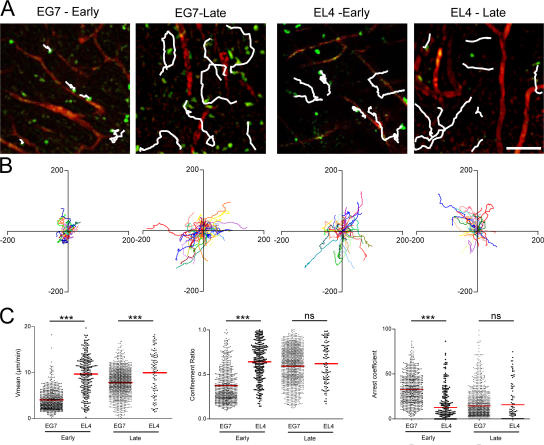
Figure 2.
CTLs motility during tumor infiltration and clearance. (A) TPLSM images (260 × 260 μm) of OT1-GFP cells (green) within tumors (EG7 and EL4) of anesthetized mice at early (day 3) and late (day 5) time points after adoptive transfer. Vascular vessels are labeled by 70 kD rhodamine-dextran (red); typical migratory path (white) examples are shown. Bar, 47 μm. (B) Overlay of 50 individual T cell tracks plotted after aligning their starting positions. (C) Scatter plots of T cell mean velocity, confinement ratio, and arrest coefficients of all cells analyzed. Data from two to four independent experiments were pooled (day 3: EG7, n = 675; EL4, n = 275; day 5: EG7, n = 1249; EL4, n = 126). ns, not significant. ***, P < 0.001.

