Figure 7.
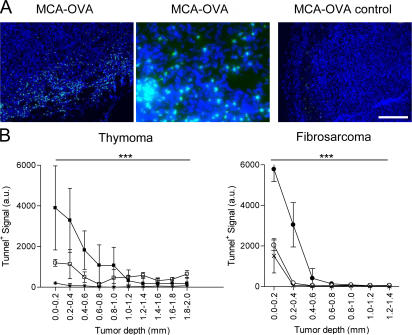
Apoptotic cells after tumor T cell infiltration. Tunnel assay after adoptive transfer of OVA-specific OT1 T cells in EG7 or MCA-OVA tumor-bearing mice. (A) Typical epifluorescence images (900 × 670 μm, right and left; 225 × 167 μm, middle) of MCA-OVA tumor sections 4 d after transfer or not of OT1 cells: cell nuclei were labeled with Dapi (blue) and apoptotic cells (green) were labeled by using the FITC-Tunnel detection kit. Bar, 204 μm. (B) Representative quantification of apoptosis in thymoma or fibrosarcoma (MCA-101) tumors expressing (closed symbols) or not (open symbols) the OVA epitope 4 d after OT1 cell transfer or not (control, crosses) (mean ± SD, three to four different tumors). The statistical differences between peripheral and deep regions for EG7 and MCA-OVA are indicated. ***, P < 0.001.

