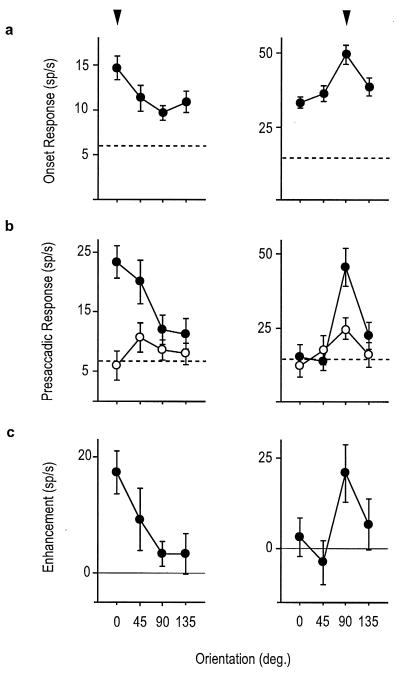
Figure 2.
Visual onset and presaccadic orientation tuning curves for two neurons. Arrows above the right and left set of curves highlight the tuning peaks for each of the two cells. (a) The orientation selectivity evident within the first 200 ms after stimulus onset, at which time the trial was identical for both saccade conditions. (b) The orientation selectivity within the 100 ms presaccadic period when eye movements were directed to the RF stimulus (•) or a saccade target in the opposite hemifield (○). (c) Enhancement tuning curves computed from the average trial by trial difference in the presaccadic activity between the two saccade conditions. Dotted lines in a and c represent the baseline firing rates. (Error bars: means ± SE.)

