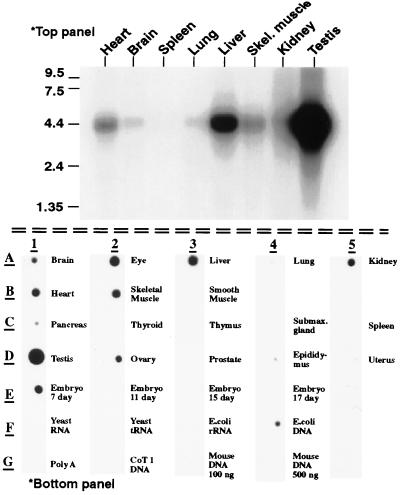
Figure 1.
Tissue distribution of PDE8 by (Upper) Northern blot analysis and (Lower) Poly(A) RNA dot blot. Top panel: Northern blot of poly(A) RNA from multiple mouse tissues. A single band corresponding to a message size of 4.4 kb is seen. Bottom panel: Poly(A) RNA dot blot from mouse tissues. PDE8 expression is detected in a variety of tissues. Relative intensity of signal as determined by using the National Institutes of Health image program was testis>eye>skeletal muscle>heart>embryo 7d>kidney>ovary>brain. Note the signal found in the negative control “E. coli DNA” is most likely due to the fact that the probe template was prepared from E. coli hosts.

