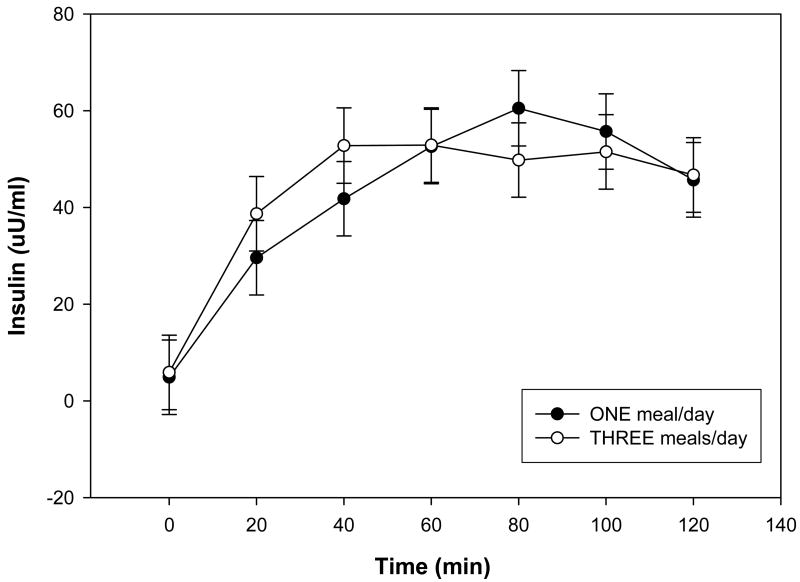
Figure 2.
Plasma insulin concentrations during the oral glucose tolerance tests during each study period. Data are presented as least squares means ± SEM, n = 15 (10 women, 5 men), from a repeated measures ANOVA. There was no significant treatment effect between the 1 meal/d (●) and the 3 meals/d (○) for plasma insulin concentrations during the oral glucose tolerance test.

