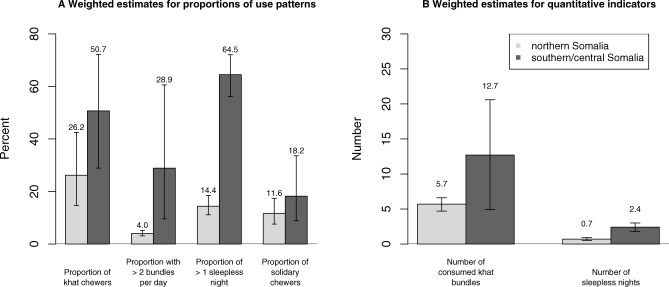
Figure 1. Comparison of Information on Self-Report Information on Drug Use of 4,751 Respondents in Northern and 3,373 in Southern/Central Somalia.
(A) Weighted estimates of proportions of khat users (week before the interview) and of respondents reporting signs of excessive use (> 2 bundles/d, > 1 sleepless night/wk, chewing alone); weights are based on sampling probability per region; error bars correspond to the 99% CIs.
(B) Weighted estimates of average quantity of khat (bundles) consumed by 1,248 users in the north and 1,707 in the south and number of sleepless nights due to khat chewing in the week prior to the interview; weights are based on sampling probability per region; error bars correspond to 99% CIs.

