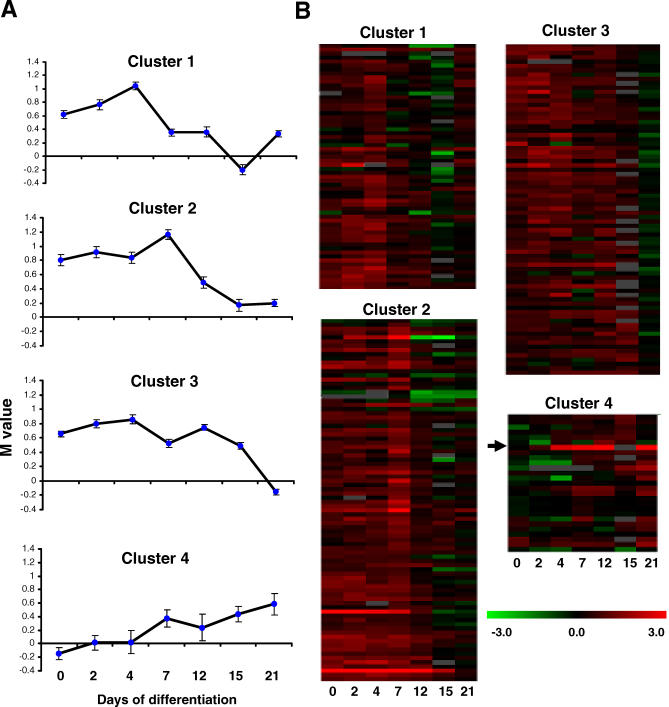
Figure 5. Genes Are Silenced at Widely Differing Times during Differentiation of Female ES Cells.
(A) X-linked genes on the array were separated into four clusters on the basis of their patterns of change in female:male expression ratio (M values) during ES cell differentiation. Median values (± SE) for each cluster at each time point are shown. Changes in M value are attributable to the progressive inactivation of genes on one of the two female Xs.
(B) Heat maps for each gene, with female:male expression ratio colour-coded from green (lowest) to red (highest) as shown on the coloured bar (lower right). Xist (cluster 4, arrowed) shows relatively strong expression in female cells from early in differentiation.

