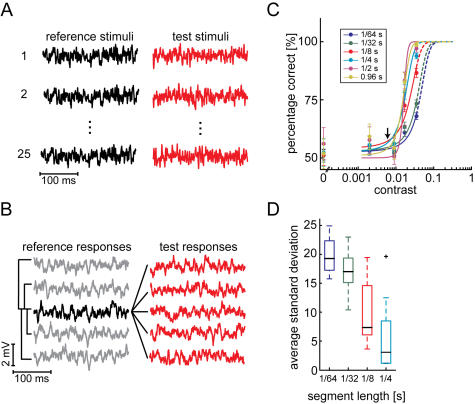
Figure 4. Signal-detection approach.
A Experimental design for the discrimination task at one contrast level. Left hand column: the reference stimulus is repeated 25 times; right hand column: different test stimuli, all statistically equivalent to the reference stimulus. Reference and test stimuli of all five contrasts were presented in a pseudorandom order. B At each contrast level the two distances 〈Dr〉 and 〈Dt〉 were estimated according to equation 5 for each reference response (e.g. the highlighted one in the left box). C Response discriminability as a function of contrast. Dots mark the average discrimination performance (N = 12) ±SEM. Discrimination performances were calculated using data segments of different lengths (see legend). Data were fitted with a sigmoid function ranging from 50 to 100% (equation 6). The arrow marks the contrast which results from photon shot noise at the background light intensity. D Uncertainty of discriminability estimation for different segment lengths. For each cell, the discrimination performance was estimated for all possible data segments. The standard deviation of these discrimination performances was estimated. The box plots describe the distribution of these standard deviations in the cell population. Boxes indicate median (black line) and the upper, respectively lower quartile the whiskers represent the rest of the data. The plus-sign denotes an outlier. The two largest segment lengths used in C subdivided response traces only into one or two segments, thus no S.D. could be calculated.

