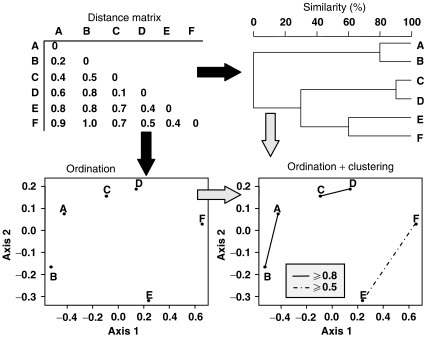
Fig. 5.
Combination of ordination and cluster analysis. On a same distance matrix, NMDS or PCOA can be applied to represent the major axes of variation among objects in a two-dimensional space. The superimposition of the results of cluster analysis (primary connections) onto the ordination diagram can help identify the structure in the data set as discontinuities (clusters) into a continuous space (ordination). Adapted from Legendre & Legendre (1998).

