3.

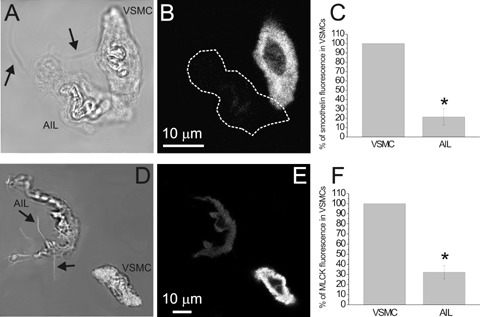
Fluorescent staining for smoothelin and MLCK. (A) Transmitted light image of an AIL cell and a VSMC and (B) an image of smoothelin fluorescence in the same cells, obtained by confocal microscopy. (C) Smoothelin fluorescence of AIL cells was 21.4 ± 8.7% of that in VSMCs (n = 10 cell pairs from three animals, P = 0.00001, statistically significant). Omitting primary antibodies (n = 29 cells from five animals) produced an average of 2.6% of the original fluorescence intensity (n = 10; not shown). (D) Transmitted light image of an AIL cell and a VSMC combined with the image of BODIPY phalloidin fluorescence of the bottom plane (in white; to enhance the visibility of filopodia). (E) As for (B), but staining for MLCK is shown. (F) MLCK fluorescence of AIL cells was 32.1 ± 6.6% of that in VSMCs (n = 9 cell pairs, P = 0.00001, statistically significant). Omitting primary antibodies (n = 7) produced an average of 8.7% of the original fluorescence intensity (n = 9; not shown). The fluorescence of both markers was localized throughout the cytoplasm of VSMCs and AIL cells, except for the nucleus. Arrows point to filopodia of AIL cells. * Statistically significant.
