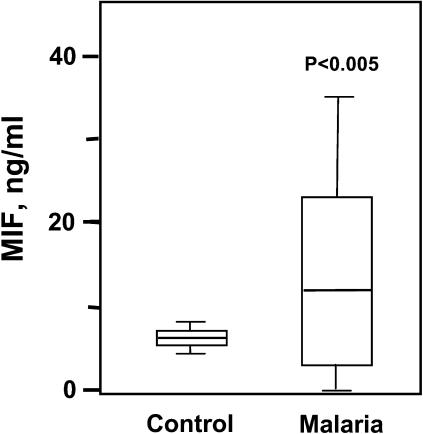
Figure 7.
Plasma MIF concentrations are elevated in malaria-infected individuals. MIF was quantified by sandwich ELISA in 20 sequentially diagnosed subjects with malaria presented to the Macha Mission Hospital in Zambia. Control plasmas (n = 20) were obtained contemporaneously from uninfected hospital controls. The bottom, middle, and top lines of the box mark the 25th, 50th, and 75th percentiles, respectively. The vertical line shows the range of values comprised between the 5th and 95th percentiles. The mean plasma MIF concentrations for the control and malaria groups were 5.4 and 13.6 ng/ml, respectively (P < 0.005 by a two-tailed Student's t test). Error bars represent SD.

