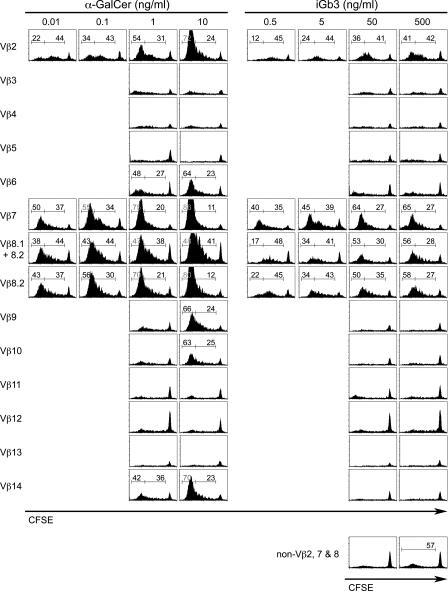
Figure 7.
Vβ-specific hierarchy of responses to graded concentrations of antigens. CFSE-labeled Vα14tg.CD1d −/− DN T cells were stimulated as in Fig. 6 using a range of antigen concentrations. Numbers in each histogram indicate the percentage of cells within the corresponding brackets of CFSE-negative (left) and CFSE-low (right) cells. Histograms with no percentages have <50% CFSE-diluted cells. Data are representative of four independent experiments.

