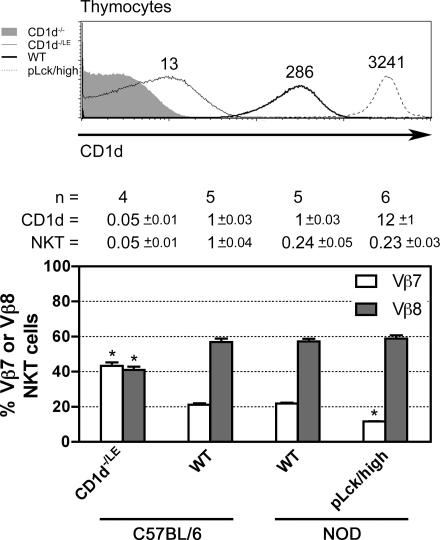
Figure 8.
Vβ repertoire changes in mice expressing high or low levels of CD1d. (top) Levels of CD1d expression (mean fluorescence intensity indicated above histograms) by thymocytes of indicated mice. CD1d −/LE are mice with a null (−) allele and a low expression (LE) allele the result of a loxP insertion in the 5′UTR of CD1d1. pLck/high are mice with high level expression of a CD1d transgene driven by the proximal Lck promoter. (bottom) Percentages of Vβ7 and Vβ8 cells among α-GalCer-CD1d tetramer+ cells were determined by FACS analysis of indicated mice. Bars represent mean and SD (white, Vβ7; gray, Vβ8) based on indicated “n” number of mice examined. “CD1d =”: relative CD1d expression level (mean fluorescence intensity) compared with B6 WT mice; “NKT =”: relative numbers of NKT thymocytes compared with B6 WT mice. *, statistical significance (P < 0.05) using unpaired Student's t test.

