Figure 5.
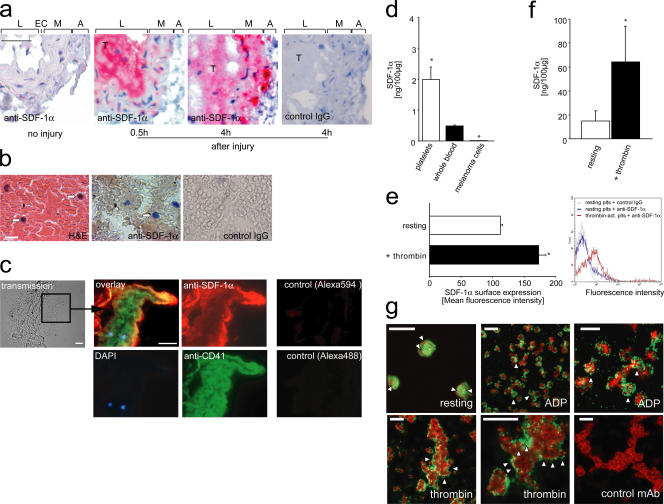
Platelets express and secrete SDF-1α and recruit endogenous PCs to sites of vascular injury. (a) Paraffin-embedded sections of a mouse carotid artery injured as described (panel a and see Materials and methods) and a fresh human coronary thrombus (b) were stained for SDF-1α. Sections incubated with irrelevant isotype-matched IgG served as controls. The intense red (a) or brown (b) staining indicates that SDF-1α is expressed in both mouse and human intravascular thrombi. In a, L, EC, M, and A indicate lumen, endothelial cells, media, and adventitia, respectively. Arrows in b indicate mononuclear cells. Bars, 50 (a) or 20 μm (b). (c) Triple immunofluorescence staining of an injured carotid artery shows that SDF-1α expression in thrombi is largely confined to CD41-expressing platelets. Mononuclear cells recruited to the thrombus are indicated by blue (DAPI). Bars, 25 μm. Sections incubated with the secondary but not the primary antibody served as controls (right). (d) We used ELISA to determine SDF-1α in mouse platelets or whole blood. The mouse melanoma cell line B16-D5 served as control. SDF-1α protein expression is given in nanograms per 100 μg total protein. *, P < 0.05 vs. whole blood. (e) Thrombin-activated human platelets surface express SDF-1α, as indicated by flow cytometry (for details, see Materials and methods). The diagram (left) summarizes three independent experiments and a representative histogram is shown (right). (f) ELISA also demonstrates that platelet activation triggers release of SDF-1α, as indicated by an increase in SDF-1α protein concentration in the supernatants of α-thrombin–activated platelets. *, P < 0.05 vs. resting. (g) Confocal laser scanning microscopy demonstrates that SDF-1α is present in the cytosol of resting platelets, whereas it becomes surface expressed after platelet activation. (top left) Resting platelets at high magnification. SDF-1α is present in the platelet cytoplasm as identified by the red staining (arrowheads); CD41 expression is indicated by green. Platelet activation by 20 μM ADP (top, middle and right) or 0.2 U/ml thrombin (bottom) induced surface mobilization of SDF-1α (green; arrowheads). The platelet cytoskeleton is highlighted by the red staining (phalloidin). Thrombin-activated platelets (bottom right) were stained with irrelevant control mAb (green) and counter-stained with phalloidin (red). Bars, 10 μm (top, middle; bottom, left and right) or 5 μm (top, left and right; bottom, middle). Data are means ± SEM.

