
Figure 8.
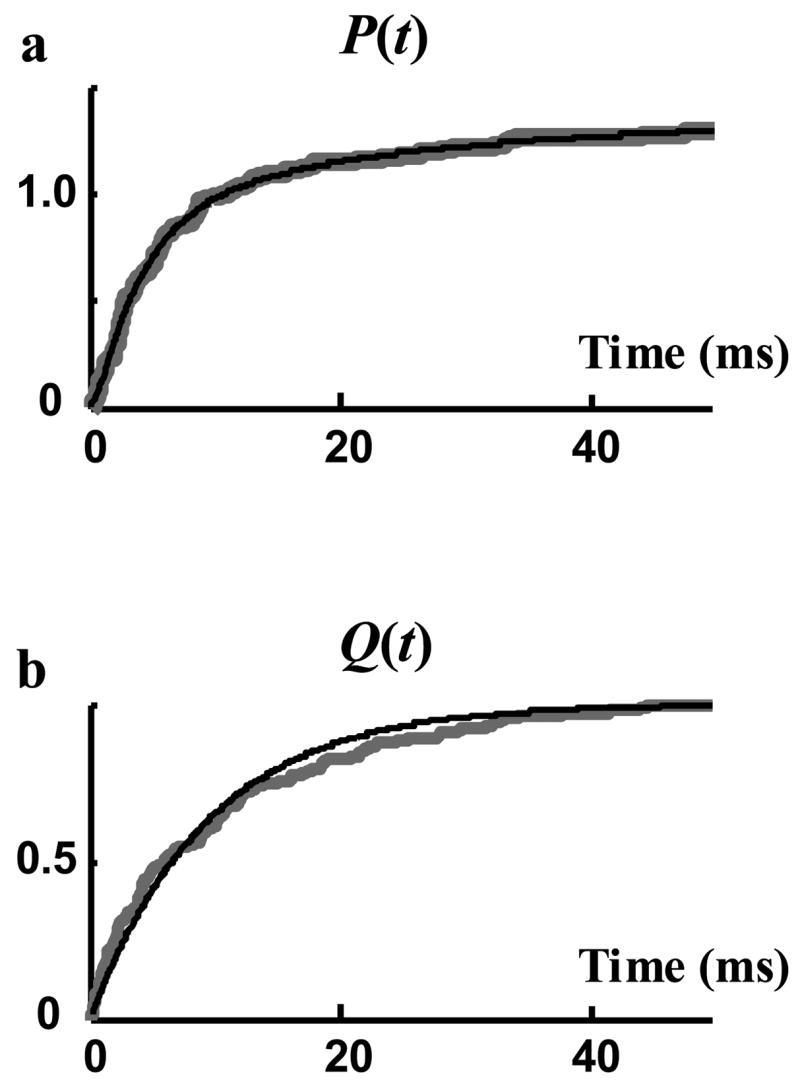
Cumulative density functions (cdf) of recorded data. Grey curves are measured directly from rectangular-pulse representation of single channel sweeps and black curves are fitted to these measured curves. a) P(t), cdf of opening events fitted with three terms exponential function. b) Q(t), cdf of the open duration fitted with a single exponential function.