
FIG. 1. TR4−/− MEF cells show increased sensitivity to UV treatment.
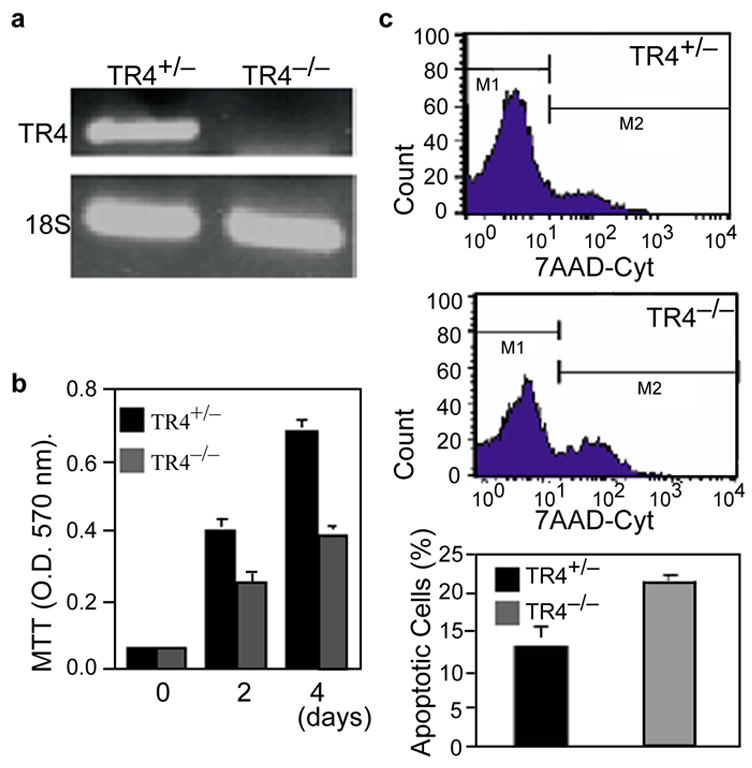
a, RT-PCR analysis of TR4+/− and homozygous TR4−/− MEF cells using specific primer amplifying exon 3 ~ 5 to distinguish TR4+/− and TR4−/−. b, Relative growth rate of TR4+/− and TR4−/− MEF cells. Values are the means ± S.D. of MTT assay readings from three independent wells. c, Flow cytometric measurement of MEF cell death induced by UV (200 J/cm2) as indicated. Cells were stained with 7-AAD and analyzed by FACSCalibur flow cytometer (Upper and middle panel). Live cells were gated as M1 and apoptotic cells were gated as M2 population in readings. Relative Percentage of apoptotic cells are shown in lowest panel as the mean ± S.D. of three individual experiments.