
Figure 1. Cumulative proportion of black and white AMI patients treated by all of the hospitals in the CCP sample.
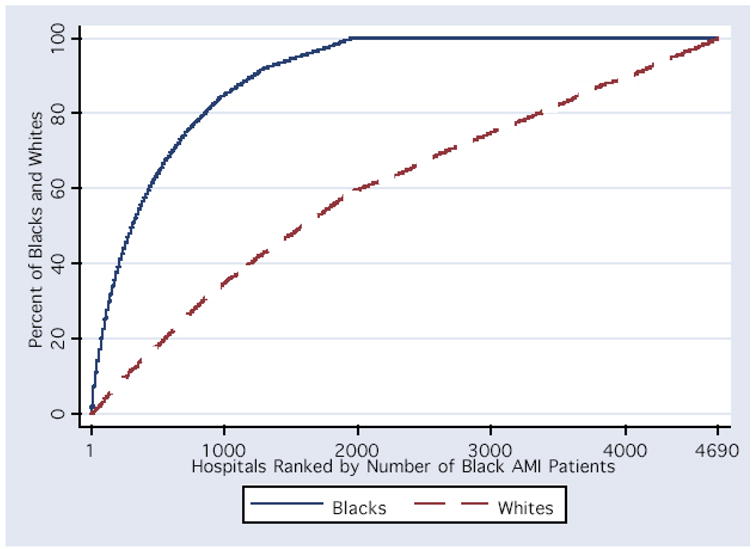
The graph depicts the cumulative distribution function for black and white AMI patients among hospitals 1-4690. Each of the hospitals in the CCP sample are arrayed on the x-axis from highest to lowest by the proportion of all black AMI patients treated at the hospital.