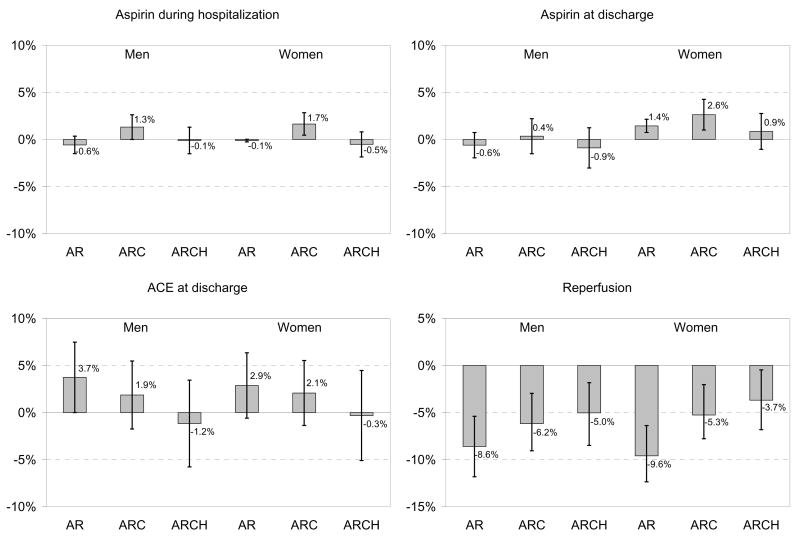
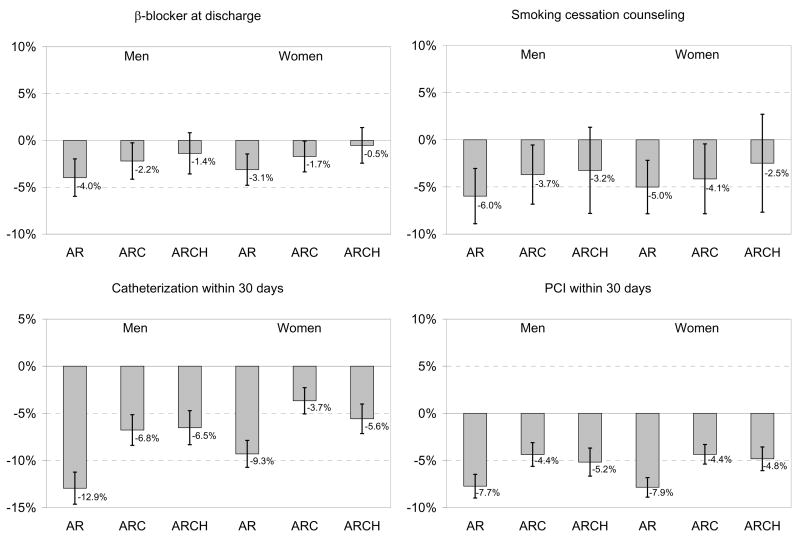
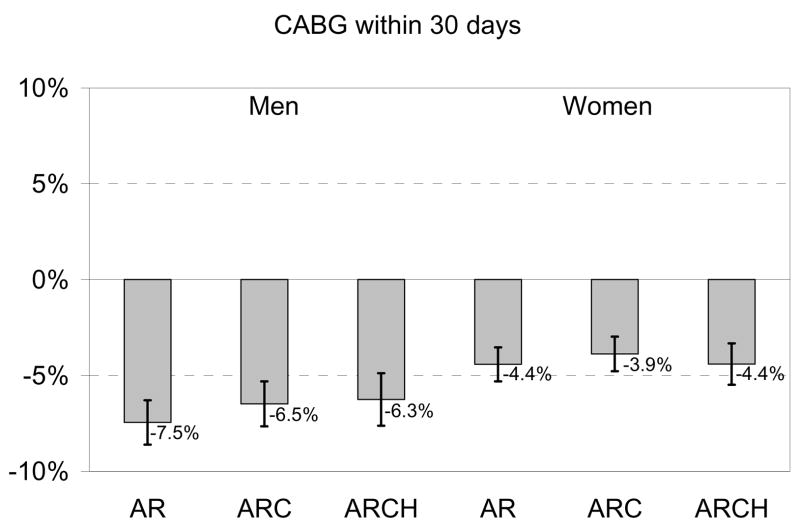
Appendix Figure 1. Black-White Treatment Disparity.
Treatment Disparity. For each treatment, we present the marginal probability of receiving the treatment if black compared to white, all other things being equal. This is the absolute percentage point difference, with 95% confidence intervals, in treatment receipt among whites compared to blacks. AR = models including only age and race; ARC = models including age, race, and clinical condition, including being an ideal candidate for therapy (CCP quality indicators only); ARCH = models including age, race, clinical condition, being an ideal candidate, and hospital.


