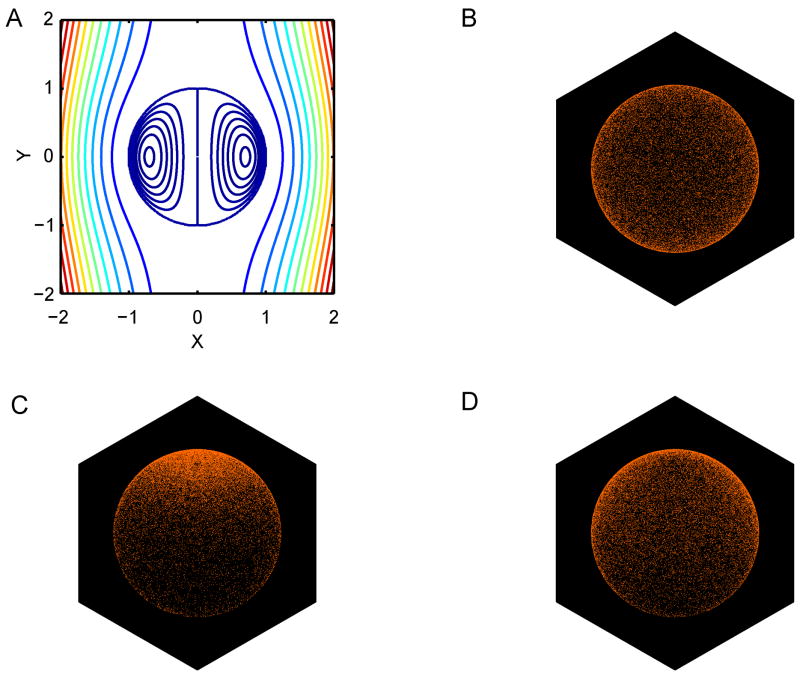
Figure 3. Monte Carlo simulation of L-selectin surface transport predicts cap formation during centrifugation.
(A) Fluid streamlines inside and outside of the neutrophil (modeled as a viscous fluid drop) during sedimentation. (B) 3-D plot showing the initial random distribution of L-selectin receptor in the Monte Carlo simulation of cell sedimentation. (C) Final surface distribution of L-selectin receptor after 50 seconds of sedimentation down 5 cm of test tube length at 280× g. (D) Final surface distribution of L-selectin receptor after 3.9 hours of sedimentation down 5 cm of test tube length at 1× g. Cell sedimentation is directed from top-to-bottom, producing an external flow directed from bottom-to-top when observed from a coordinate system moving with the cell center.

