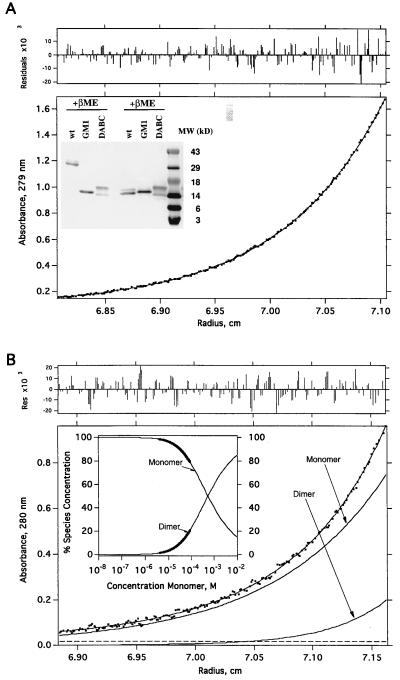
Figure 2.
Size analyses of DABC and GM-1. (A) Equilibrium sedimentation data of DABC in 150 mM NaCl and 20 mM phosphate (pH 7.4). Initial loading concentrations were ≈0.3 A280 (≈32 μM). The protein was centrifuged for >20 h at 20°C, until equilibrium was reached (see Methods). The molecular mass determined from this analysis was 14,966 ± 49 Da. There was no evidence of self-assembly to the dimeric form. (Upper) The distribution of residuals for the fit of the primary data (absorbance at 280 nm vs. radius) to a model for a single species (23) is shown. (Inset) SDS/PAGE analysis. Affinity purified samples (≈2 μg) were run on a 16% gel either reducing (Right) or nonreducing (Left). (B) Equilibrium sedimentation data for GM1. The data were fit with K1,2 = 5.2 ± 0.4 × 10⁻⁴ M. Shown also are the individual curves computed, according to the analysis, for monomer and dimer separately. Experimental conditions are the same as for the DABC data (A). (Upper) The distribution of residuals for the fit of the primary data, a monomer-dimer equilibrium (23) is shown. (Inset) This shows the fraction of monomer and dimer as a function of total protein concentration computed from an analysis of the data according to a monomer-dimer model. The bold portions of the curves indicate the concentration ranges over which the data were actually fit. The thin portions of the curves are extrapolations according to the model. From this analysis one can show that at a total GM1 concentration of 10−5 M, the fraction of dimer is 3.5%.

